How to convert lidar surveyed sites into polygonal data that can be used in Architect
This guide will work through using Meshlab a 3D mesh processing software and use it to convert point clouds - captured using Ouster sensors and processed with SLAM - into polygonal data which can be loaded into Ouster’s Architect. Architect helps users plan their sensor installation and identify areas that are lacking coverage from the sensors.
For the purpose of this tutorial we are going to use the following dataset
By the end of this tutorial we are going to convert the point cloud into polygon data and load it into Architect and setup few sensors as shown below
First grab the dataset that we will work with. We will use the ply file since it has the SLAM processed output. So follow the dataset link and expand the “Download” menu then click “ply” as shown below:

Next, we need to install Meshlab, We can grab the latest which you can download from its official website: MeshLab. Download the version that is appropriate for your operating system. It might be also possible to install the application via OS Apps Marketplace, however, it may not be the last version.
Once the software is installed, run the application and load the ply file by selecting the “Import Mesh” command from the “File” menu.
The dataset is somewhat large (~3 million points) so it can be hard to work with. To deal with that we are going to use point clustering to reduce the size of the point cloud. Using the “Filters” menu expand the “Remeshing, Simplification and Reconstruction” submenu then click the “Simplification: Clustering Decimation” command. The image below shows how to access the command.
This will pop the following dialog with a cell size parameter, for the purpose of this sample we will use 0.5 as the cell size:
One you hit apply, the software will take few moments to process the command. Once it is done the resulting point cloud should have less than 200k points (down from 3 million) as shown in the image below:
Largely, the map still maintains its features.
Before proceeding further, it is worth noting that Meshlab doesn’t have an undo button, if you need to take a step back it is important to take checkpoints by saving the mesh to different files after each step.
Next we need to remove some of the noise surrounding the map, we will do this manually by selecting the “Select Vertices” command ![]() from the toolbar, then highlight all outliers and remove them using the “Delete Verticis”
from the toolbar, then highlight all outliers and remove them using the “Delete Verticis” ![]() command as shown below:
command as shown below:
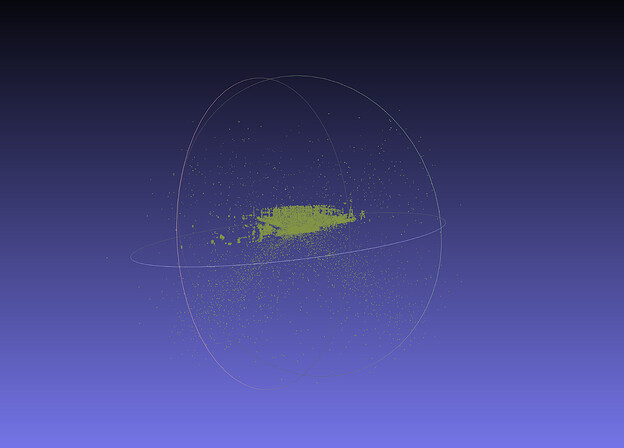
We will need to repeat this multiple times. By the end of this step we should have a map that looks like this:
The cleaner the map the better the results would be.
Note that Meshlab has an automatic “outlier selection” under the “Filters”->”Selection”, however this didn’t generate good results for me so I didn’t use it.
Now we are ready to perform the conversion by invoking one of the “Surface Reconstruction” techniques under the “Filters”->”Remeshing, Simplification and Reconstruction” menu. You will note that there are two main options that can be applied here:
- Ball Pivoting
- Screened Poisson
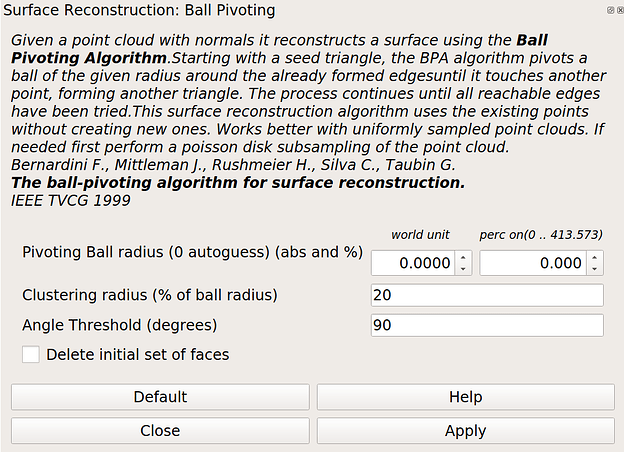
For this scene it is better we use “Ball Pivoting” as “Screened Poisson” is better suited for captures of watertight models. Once selected the following dialog will pop up:
The main parameter we will focus on is the Pivoting Ball radius, you could leave this default at zero and the algorithm will choose an appropriate radius but in my case I used 0.5 which is the same value we used during the “Simplification: Clustering Decimation” step. Generally, speaking you want to choose a value that is within the range of the distance between points that you would rather be connected to one surface. If in doubt you can use the tape measurement tool ![]() from the toolbar menu.
from the toolbar menu.
This operation may take several minutes to complete but once done you may close the dialog box and proceed to examine the results. To do so make sure to uncheck the points view option ![]() from the toolbar and check/uncheck
from the toolbar and check/uncheck ![]() the wireframe and solid rendering states. For example, here is what the output should look like while only the wireframe rendering is turned on:
the wireframe and solid rendering states. For example, here is what the output should look like while only the wireframe rendering is turned on:
Also note that the object has an associated face count:

Next we are going to use the “Compute normals for point sets” from the “Normals, curvature and orientation” under the “Filters” menu. Once the command is done processing the lighting will appear correct for most of the map.
There is no good way to fix the incorrect normals, the only option I came up with is to select the face in question and use the “Invert Faces Orientation” command under the same submenu we used earlier.
Finally, we are going to export to the generated model to a format that “Architect” can load and display. To do that use the “Export Mesh As …” under the “File” menu, then choose the “Alias Wavefront Object (*.obj)” as shown below:
Now we can go to “Architect” portal and load the file we have just saved. Once in Architect use the “Import Model3D” option as shown below to import the saved map.
Then add the map to the scene using te ![]() button:
button:
Yoy may then use Architect move command ![]() to align the site to the xy plane. Click on the add sensor command
to align the site to the xy plane. Click on the add sensor command ![]() to start adding sensors to the site.
to start adding sensors to the site.
Meshlab is a very rich with many tools at the user disposal, there are other steps and different parameters one could choose from which may improve the end result.


